| |
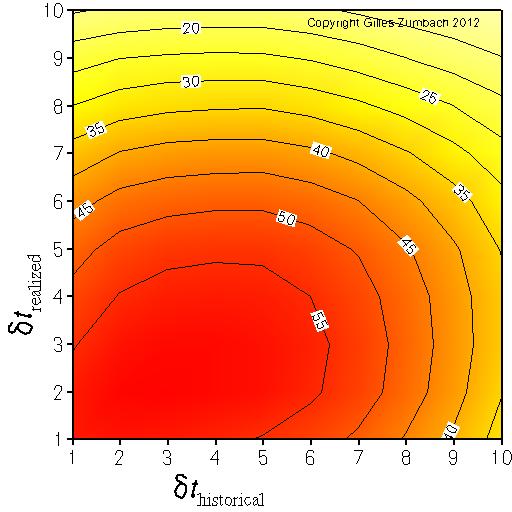
The lagged correlation between fine and coarse grained volatilitiesThe axes give the logarithm (base 2) of the return time horizons dt used to compute the volatility. |
|
|
This graph explores the information contained in the volatilities at a fixed time horizon dT, but with different "graining" dt.
The volatility is essentially an estimator for the variance of the returns inside a given time interval of length dT.
A simple quadratic definition for the volatility σ[dT, dt] depends on two time intervals:
Notice that with a coarse definition of the volatility (large value on the axes), the number of returns used to compute the volatility is small, and hence the statistical volatility estimator has a large variance. This effect leads to the lower correlations on the upper border and the right border. The efficiency of the estimator is combined with the "graining" effect to produce the observed graph. On the empirical data, notice that the maximum for the correlation is not with the finest graining. This indicates that historical coarse grained volatility contains more information about the realized volatility compared to the finest grained volatility (i.e. n = 1) |
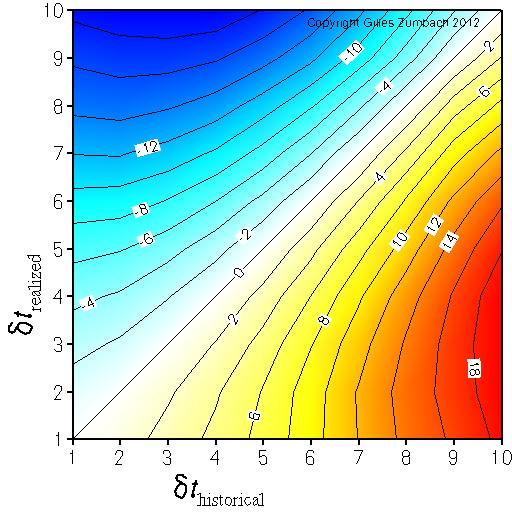
Asymmetry for the lagged correlation between fine and coarse grained volatilityThe axes give the logarithm (base 2) of the return time horizons dt used to compute the volatility. |
|
|
The asymmetry in the previous figure.
This measure the asymmetry in the correlations between historical fine grained and realized coarse grained versus historical coarse grained and realized fine grained volatilities. The positive asymmetry (yellow - red) in the lower right corner indicates that historical coarse grained volatility predicts better realized fine grained volatility than the other way around. |